
- Stocks, bonds, ETFs, and mutual funds
- Cryptocurrency pairs and crypto currency simulator environments
- Forex instruments and futures contracts
- Options and other derivatives
Paper Trade Trading View: How to Practice Trading Without Risking Money
3 October, 2026
0 comments
What Paper Trading Actually Is
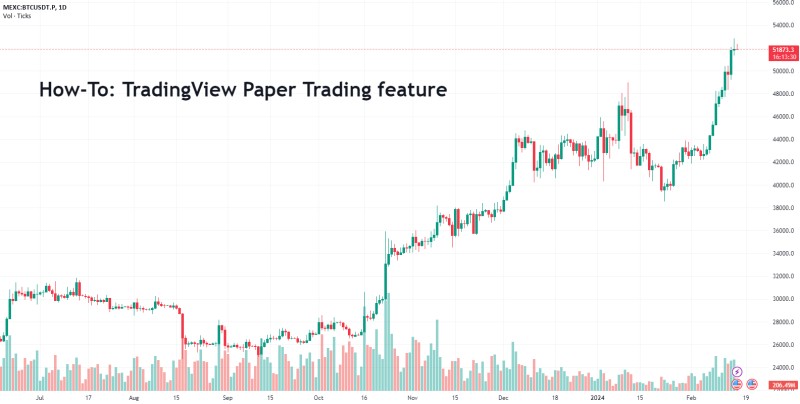
A paper trade is basically a pretend trade. You buy or sell a stock, crypto, forex pair, futures contract, or option without using real money. You just use virtual funds and pretend it's real.
The idea is simple. You open a simulated account, get some fake cash, and start placing orders. The charts and market data look real. The mechanics work like live trading. But if you mess up, nobody loses actual dollars.
TradingView paper trading gives you exactly this setup. You get a virtual portfolio, live charts, and the ability to test ideas before risking anything. It's one of the more popular ways beginners start learning how markets work.
The data can come from real-time feeds, delayed feeds, or historical records. You pick your starting balance, your position sizes, and your risk limits. Some platforms let you go long, some focus on shorts, and others handle both. The exact setup depends on what you're trying to practice.
What paper trading covers
Paper trading is presented as a way to observe the market, research, test decisions, and prepare before committing real capital.
Why People Use Paper Trading
Let's be honest. Most people start trading because they want to make money. But jumping straight into real capital is a fast way to learn painful lessons. Paper trading lets you skip the early bruises and focus on building skills.
For beginners, the biggest value is learning without real financial consequences. You figure out how orders get entered, how positions open and close, and how gains and losses accumulate. You can test different instruments, order types, and technical indicators in a controlled setting.
Experienced traders use it too. Maybe you want to refine an existing strategy, test a new market, or check how a setup behaves during different conditions. Markets change. Volatility shifts. Liquidity comes and goes. A simulator lets you review those changes before you risk more money.
Key reasons traders use paper trading
- Learning order entry and position management without risk
- Building familiarity and confidence through repeated practice
- Understanding how prices react to economic and political events
- Testing strategies from your own research or from educators
- Tracking performance metrics like wins, losses, drawdowns, and MFE/MAE
But here's the thing that trips people up. The quality of the experience depends on attention and intent. Just opening a paper account and placing random trades produces little useful information. You need focused practice, historical research, rule-based testing, and honest review to get value from it.
The practice-session comparison asks whether an athlete who merely puts on shoes and shoots baskets for a few hours would be preparing effectively for a game. Trading works the same way.
Setting Up Paper Trade Trading View
If you want to try paper trading tradingview , the setup is straightforward. TradingView describes its paper trading feature as an educational environment that closely simulates real market conditions. The goal is to give you a realistic preview of how a trading plan might perform without exposing you to monetary loss.
The process has six basic steps. First, choose a platform and compare what it offers - markets, data, replay functions, order types, charting tools, journaling features, and backtesting functions. Second, create an account. Third, explore the interface and learn where the charts, order-entry area, position list, and balance panel are located.
Fourth, create a virtual portfolio. Pick your securities, assign virtual funds, and set position sizes that reflect your intended live risk. Fifth, start trading with live or replayed data. Sixth, review your results, compare trades with your planned strategy, and make adjustments.
Six steps to set up paper trading
- Choose a platform based on markets, data, and replay functions
- Create an account with email and any required verification
- Explore the chart, order-entry, and position panels
- Build a virtual portfolio with realistic starting capital
- Place orders and monitor positions using live or replayed data
- Review results, calculate metrics, and improve your approach
One thing I want to flag here. Don't start with an arbitrary large balance just because the platform offers it. A default of $100,000 in simulated capital doesn't make trading that amount risk-free. Your starting balance, position sizes, and risk per trade should connect to a realistic plan - the same way you'd treat a funded account.

What TradingView Offers
TradingView's paper trading feature includes an educational sequence that covers initiating a paper account, placing trades, tracking positions, and evaluating your approach. The material walks you through examining the feature, testing a plan, observing positions, and evaluating results before moving to real capital.
The platform also supports a wide range of instruments. You can practice with stocks, ETFs, bonds, currencies, cryptocurrencies, futures, and options. The charting tools are strong - lots of built-in indicators, community-contributed scripts, and a backtesting editor called Pine Script.
TradingView crypto currency support is part of this package. You can test bitcoin strategies, track cryptocurrency live chart data, and experiment with different timeframes - all without spending a dime of real money.
The educational sequence covers initiating a paper-trading account, placing trades, tracking positions, and evaluating the resulting approach.
Treating a Paper Account Seriously
A paper account works best when you treat it like a real account. That means selecting a realistic virtual starting balance, using position sizes that match your intended live risk, and setting fixed risk limits for each trade and each day.
Write your entry and exit rules before opening a position. Record the reason for every trade. Avoid changing your strategy after an outcome without documenting the change. Review both winning and losing trades. Track commissions, spreads, and slippage when the simulator supports them.
A trading journal helps here. It can hold the date, instrument, timeframe, setup, direction, entry, stop, target, exit, size, result, planned risk, strategy, mistakes, emotions, and notes. Some people add screenshots before and after trades. The journal's job is not just to document - it's to identify whether the strategy or your decisions produced the result.
What to track in a paper-trading journal
- Date, instrument, timeframe, and setup
- Entry, stop, target, exit, and size
- Result, planned risk, and R-multiples
- Strategy name and rule compliance
- Mistakes, emotions, and notes
- Screenshots before and after the trade
Using Realistic Parameters
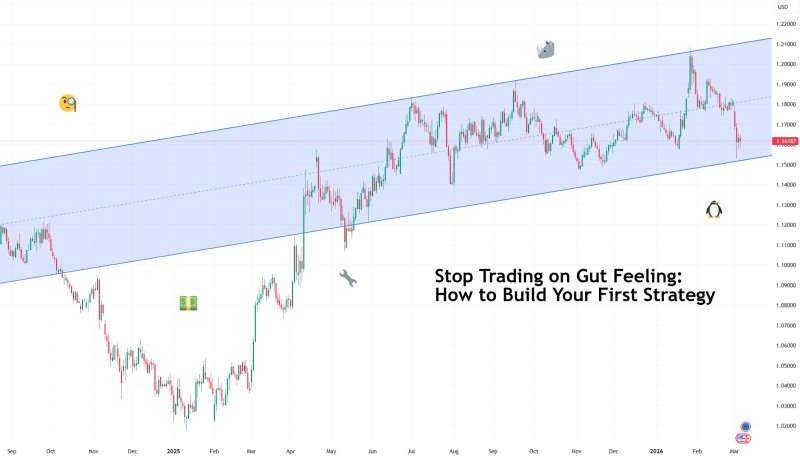
Paper-trading simulations get more informative when their parameters match the conditions you'll face for real. Relevant parameters include starting capital, risk per trade, position-sizing method, maximum open positions, maximum daily or weekly loss, and maximum account drawdown.
Don't assume that a large virtual balance will produce the same behavior as a smaller funded account. Position sizes and risk percentages need to be set before testing so the results actually represent your planned live approach.
Also think about commission assumptions, bid-ask spread assumptions, slippage assumptions, order-fill behavior, trading hours, margin requirements, stop-loss behavior, and take-profit behavior. The more realistic your setup, the more useful your practice will be.
A trader should not assume that a large virtual balance will produce the same behavior as a smaller funded account.
Backtesting a Strategy
Backtesting applies strategy rules to historical prices to estimate how the strategy would have performed. It's like a flight simulator for a trading strategy - you can watch failures without losing real money.
TradingView's Pine Script editor lets you apply strategy rules directly to a chart. The process is simple. Start with a clearly defined script. Apply it to weeks, months, or years of data. Compare results with your intended strategy. Review the metrics. Modify or reject rules that don't survive the test. Then test the revised version under additional periods and market conditions.
Backtest reviews should include win rate, number of trades, average gain, average loss, average win-to-loss ratio, largest winning trade, largest losing trade, maximum drawdown, percentage of time exposed to the market, profit factor, expected result per trade, and performance by timeframe, session, instrument, and market regime.
Key backtest metrics to review
- Win rate and number of trades
- Average gain and average loss
- Win-to-loss ratio and profit factor
- Maximum drawdown and expected result per trade
- Performance by timeframe, session, instrument, and regime
- Exposure to gaps, news, and unusual volatility
A strategy that performs poorly across the backtest is unlikely to work reliably in live markets. A short favorable backtest is not enough by itself. The sample length and range of market conditions matter too.
Position Sizing and Fixed Risk
Risk management material says beginners often overlook position sizing and later regret it. The amount you select for risk before a trade opens should be decided in advance and applied consistently.
Most professionals risk about 1% to 2% of total capital on an individual trade. The source uses a stricter 1% example for beginners. The math is clear: a trader who risks 1% per trade and loses ten in a row would be down about 10% under simplified assumptions. A trader who risks 20% per trade on the same losing streak would be down 89%.
That's arithmetic, not optimism. A large position can turn a normal losing streak into a severe drawdown. Position sizing determines how many losses your account can absorb before you're forced to abandon the strategy or add more capital.
The point is arithmetic rather than optimism. A large position can convert a normal losing streak into a severe account drawdown.
Other restrictions worth considering: maximum daily loss, maximum weekly loss, maximum open risk, maximum correlated positions, maximum drawdown before strategy review, maximum number of trades per session, maximum risk during volatile news, and a rule for pausing after a sequence of losses.
Risk-to-Reward, Win Rate, and Expectancy
Risk-to-reward describes the planned distance between risk and potential reward. A trade targeting three units of reward for every one unit risked is a 1:3 ratio. A 1:2 trade targets two units of reward for one unit of risk.
Many beginning traders chase large ratios like 1:3 or 1:5. They run winners hoping for bigger results or avoid trades without a large nominal reward. The risk is that a high ratio usually pairs with a lower probability of reaching the target.
One source claims a 1:3 system with a 30% win rate can produce results similar to a 1:1 system with a 60% win rate - even though the two systems feel very different to the trader. The source does not present a single ratio as universally correct. It focuses on consistency, expectancy, drawdown, and the trader's ability to execute planned rules.
Common risk-to-reward setups
- 1:1 - equal risk and reward
- 1:2 - two units reward per one unit risk
- 1:3 - three units reward per one unit risk
- Variable - depends on strategy and market conditions
Expectancy is the average amount a trader expects to make per trade over time. It combines win rate with average risk-to-reward results. A strategy can have positive expectancy even when it loses more often than it wins - but the losses must stay controlled and the winners must be large enough to offset them.
The Psychology of Losing Streaks
A 1:3 trade that requires three wins for every ten trades also implies seven losses. Those losing streaks create emotional pressure even when the strategy's long-term expectancy is positive. The source emphasizes that traders often blame market conditions, lose motivation, stop reviewing trades, and depart from a system that looked mathematically sound.
A system with a lower ratio but a higher win rate can generate frequent small gains. The psychological effects may include a stronger sense of momentum after repeated successful exits, less frustration watching unrealized gains retrace, and more willingness to journal and review.
The source contrasts this "winners effect" with the opposite of repeated losses. The argument is that the better system is not always the one with the largest payoff. It's the one that keeps positive expectancy while being executable over many trades.

The Law of Large Numbers
The material uses two examples of expected losing streaks. With a 50% win rate, a trader will hit a streak of six losses at some point. With a win rate near 30% and targets based on 2R or 3R, the trader may face a streak of nine losses.
A trader taking one trade per day could experience a six-loss sequence as an entire weak week. The nine-loss example raises the real question of whether a trader will keep following the system after several large losses or abandon it emotionally.
The source treats these streaks as mathematically realistic - not as evidence that a system should immediately be changed. At the same time, it acknowledges that no trading system can be executed as if the operator has no emotions. Emotional stability, risk capacity, and the ability to continue executing are part of the strategy's practical conditions.
Higher risk-to-reward ratios usually produce lower win rates, which can produce longer and more frequent losing streaks. Emotional stability and the ability to continue executing are therefore part of the strategy's practical conditions.
Variance and Equity-Curve Stability
Variance is described as the difference between the best and worst possible outcomes, linked to the stability of the equity curve. The source says this shifted the focus from seeking the largest individual profits to concentrating on emotional stability and consistent execution.
The desired equity curve grew slowly but steadily, with smaller ups and downs than an approach based mainly on high-ratio trades. The practical choice is between two forms of pain: a higher-ratio approach with fewer wins and more losses, or a lower-ratio approach with more frequent wins but some gains left unrealized.
The source presents sustainability as more important than the largest displayed target. That's a lesson worth paying attention to, especially if you're new to this.
Paper Trading Versus Live Trading
Live trading creates psychological conditions that paper trading may not reproduce. A virtual drawdown doesn't reduce real spending money or threaten real capital. That difference affects risk tolerance, discipline, and willingness to cut a loss.
Several major differences separate simulated and live trading. No real profit or real loss in a paper account. No direct financial consequences during simulation. Potentially simpler execution assumptions. Possible omission of bid-ask spreads, liquidity constraints, slippage, or delays. Less adrenaline when virtual funds are at risk. Different emotional responses to gains and losses.
Greater risk of complacency after simulated success. Possible overconfidence when results appear consistently profitable. Lack of exposure to unforeseen live-market events. No automatic transfer between a virtual mindset and a funded mindset.
A paper trader can become comfortable taking large simulated risk because there is no bill, withdrawal, or margin call. The same behavior can become destructive when real capital is involved.
The source therefore characterizes paper trading as valuable for mechanics, preparation, research, and controlled strategy testing - but not as a substitute for live experience. Professional traders may continue using simulation when introducing a new strategy, market, product, or order process. No real money can be earned directly from a paper trade. Its financial value comes from the possibility that skills, discipline, and strategy knowledge developed during simulation may be applied in a live account.
Transitioning from Paper Trading to Real Capital
One strategy-building progression proposes starting with real capital so small that the position feels minor, learning the mechanics, and following the rules for 20 to 30 trades before increasing size. The source says even a small real-money position can sharpen attention compared with simulation.
Another recommendation calls for at least 30 to 90 days of consistent paper trading with a documented strategy, a complete journal, and performance across at least one full market cycle.
These guidelines are different but not identical. The first uses a trade count of 20 to 30 trades. The second uses a time range of 30 to 90 days and at least one market cycle. The two standards emphasize different dimensions of preparation. A trader could complete 20 trades in less than 30 days or remain in simulation for 30 days without completing enough trades to evaluate a rule-based strategy across varied conditions.
Two common transition benchmarks
- 20 to 30 trades with documented strategy and review
- 30 to 90 days with a complete journal and full market cycle
- Small real-money position to sharpen attention
- Rules for risk, execution, and position size continue unchanged
The transition also requires recognizing the psychological difference. Small live positions can still create emotions absent from a paper account. Rules for risk, execution, and position size are intended to continue unchanged when scale increases.
Day Trading Practice and Intraday Time Frames
Day traders may use simulation to learn intraday strategies during periods of heightened volatility. The cited timeframes include 1-minute charts, 5-minute charts, 15-minute charts, 30-minute charts, and hourly charts.
Practice should include more than entries. A day trader can review how strategies behave around the opening, midday, close, economic announcements, large overnight gaps, and periods of changing liquidity. Market conditions should also be studied - economic and political factors can affect securities, and historical research can examine how a chosen category behaves during corrections, expansions, rallies, selloffs, or market bubbles.
If you're looking for a setup to practice day trading stocks , a paper-trading environment with live or replayed data gives you a risk-free place to learn the rhythm of intraday moves. The source also mentions the Wyckoff Price Cycle as a framework for understanding rises, falls, booms, busts, and market cycles. Prices do not rise forever, and traders need explicit profit-taking rules as well as loss-cutting rules.
Paper trading should also be used to compare rule-following with discretionary behavior. A trader can record whether it was more profitable to keep the original stop, move the stop, enter earlier, wait for confirmation, take partial profit, hold to the final target, stop trading after a daily loss limit, or continue after a sequence of losses.
Problems With Paper Trading
Paper trading has real limitations, and it's worth knowing them upfront. The first is lack of real consequences. Virtual gains and losses can lead to complacency, larger-than-intended risk, or unrealistic confidence. The emotional pressure associated with real money is absent.
Second is limited market simulation. Bid-ask spreads, order delays, liquidity, partial fills, and other execution details may be simplified or missing. A strategy can appear profitable because simulated entries and exits differ from available live prices.
Third is psychological disconnect. The fear of losing real money and the excitement of real gains can change behavior. A trader may discover during live trading that holding a position, admitting a mistake, or cutting a loss feels different with capital at risk.
Fourth is the overconfidence trap. A long successful simulation can produce unrealistic expectations. Real markets contain events and conditions that a simulation may not capture. And fifth, no substitute for real experience exists. Dynamic markets, technical outages, emotional challenges, execution problems, and unforeseen events cannot be reproduced completely.
Five limitations of paper trading
- No real financial consequences, leading to complacency
- Simplified execution, missing spreads, slippage, and fills
- Different psychology when real capital is at risk
- Overconfidence from long successful simulations
- Cannot reproduce dynamic markets or unforeseen events
A trader can reduce these limitations by using realistic fills, conservative assumptions, documented commissions, a small funded allocation when appropriate, and an explicit transition plan. But the source still treats live experience as something paper trading cannot replace.
Reviewing Your Paper-Trading Routine
A structured review can include these steps. List every trade and open position. Compare each entry with the rule that authorized it. Compare the exit with the planned stop or target. Calculate planned and actual risk in dollars and R-multiples.
Classify the result as a strategy loss, an execution error, or a rule-compliant outcome. Record emotions before, during, and after the trade. Identify repeated mistakes. Compare performance by setup and market session. Compare paper performance with intended live parameters. Make one documented change at a time, then retest before increasing risk.
The routine can also include P&L in both currency and R units. One R represents the amount initially selected for risk on a trade. This makes trades of different dollar sizes easier to compare.
Structured review checklist
- List every trade and open position
- Compare entries with authorizing rules
- Compare exits with planned stops or targets
- Calculate planned and actual risk in dollars and R-multiples
- Classify results as strategy loss, execution error, or rule-compliant
- Record emotions and identify repeated mistakes
- Compare performance by setup and market session
- Make one documented change at a time
- Retest before increasing risk
Tools for Tracking Performance
TradesViz is described as an online trading journal, simulator, backtesting, and analysis platform. Its TradingView integration is designed to import or synchronize trading records and generate charts, key performance indicators, risk metrics, notes, and strategy analysis.
The data functions include importing TradingView trades, managing historical imports, applying automated commission assumptions, generating more than 100 charts and key performance indicators, tracking win rate, expectancy, drawdown, MFE, MAE, and equity curve, replaying trades on multi-timeframe charts, and breaking performance down by session.
The platform can provide more than 600 charts on top of P&L charts. Custom dashboards can contain more than 50 widget types, including P&L calendars, equity curves, win-rate charts, symbol breakdowns, time analysis, and heatmaps. Dashboards can be resized, rearranged, saved under different layouts, and separated by strategy, timeframe, or account type.
TradesViz plan tiers
- Basic - free, 3,000 imports per month, 50+ visualizations
- Pro - $19.99/month or $14.99/year, unlimited imports, AI features
- Platinum - $29.99/month or $22.49/year, real-time screening, backtesting with 70+ indicators
Options Trading on TradingView
On a date in late 2025, Alpaca announced options trading integrated with TradingView through an Alpaca Trading API account. The integration extends an existing API connection used for stocks, ETFs, and cryptocurrency. Its stated purpose is to combine visualization, analysis, and execution within one interface.
The integration supports multi-leg options strategies including straddles, iron condors, iron butterflies, credit spreads, debit spreads, and calendar spreads. The TradingView Strategy Builder visualizes an options strategy before execution, displaying maximum profit, maximum loss, breakeven, and payoff for different strategy structures.
This live options integration is separate from Alpaca's statement that its Paper Trading API cannot transact in real securities. Options trading is described as unsuitable for every investor because of high risk and potential for significant loss. Alpaca's broker structure is Alpaca Securities LLC, a FINRA and SIPC member and a wholly owned subsidiary of AlpacaDB, Inc.
The unified workflow allows a trader to move from analysis to execution in a few clicks, obtain current options data and quotes, manage open positions, and monitor the options portfolio within TradingView.
Learning From the Community
The paper-trading guidance suggests studying techniques and strategies of experienced traders through books, videos, reputable educators, and historical examples. This learning can be combined with a journal so theory connects to specific decisions and outcomes.
The source emphasizes that progress takes time. Many successful traders spend years in trial and error. Even strong traders undergo repeated losses while learning what works. Mentors and trading educators can be treated as sources of hypotheses that still require independent testing. A successful paper result should come from defined conditions rather than blind acceptance of a demonstrated trade.
Risk and Use Limitations
TradingView states that its information and publications are educational and do not constitute financial, investment, trading, or other advice or recommendations. TradingSim states that simulation cannot supply the complete emotional pressure of live capital. TradesViz states it is not an investment adviser and that futures and forex involve substantial risk.
Alpaca states that its Paper Trading API does not transact in real securities, while its live options integration does not remove the financial risks of options or other investments. Market data, automated systems, third-party access, conditional orders, margin, cryptocurrency, and execution conditions can create losses even when an account is simulated or connected through an API.
Past simulated performance is not necessarily indicative of future results. No strategy is guaranteed to achieve its objectives, and diversification does not assure profit or protect against loss. These are standard disclosures, but they matter - especially when you're building confidence through practice.
Paper trading is valuable for mechanics, preparation, research, and controlled strategy testing, but not as a substitute for live experience.
The bottom line is that paper trade trading view is a useful tool when used with intention. It's not magic, and it's not a replacement for real-market experience. But done right - with realistic parameters, a documented strategy, a complete journal, and honest review - it can help you build the skills and confidence you need before risking real capital. The key is to treat the simulation seriously, review your results systematically, and keep learning from both wins and losses.


Comments on “Paper Trade Trading View: How to Practice Trading Without Risking Money”
No comments yet. Be the first to share your thoughts.